Meant to post this late Thursday.
Once again, tomorrow’s featured economic release will be the Employment Report for March. Set to hit the tape at 7:30 am cst Friday, more than one economist is expecting the largest one month drop in 60 years. With consumer spending at a standstill and factory output continuing to slide, companies are idling plants, cutting back on hours worked, or pink slipping employees all together. Last month the numbers looked like this; Non-farm payrolls down 651K, unemployment rate 8.1%, Average Hourly Earnings plus .2, and Average Workweek at 33.e hours. Estimates for tomorrows print are as follows:
- Non-farm Payroll – Minus 654K jobs
- Unemployment Rate – 8.2%
- Average Hourly Earnings – Up .2 month on month
- Average Work Week – Unchanged at 33.3
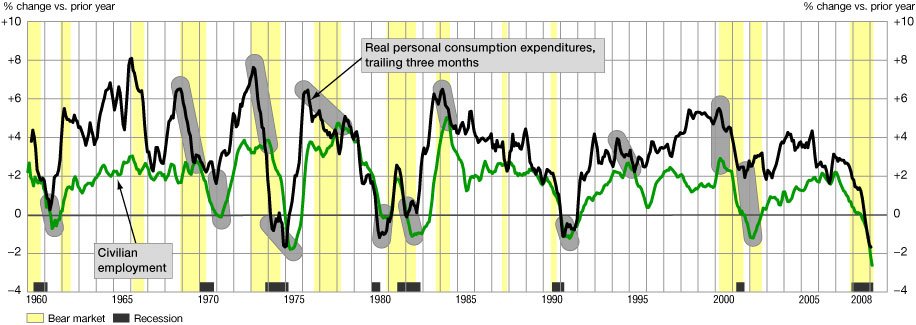
While we can agree with the AHE and AWW, the tough call is how bad will this jobless number be. Given the continued weekly posting of record unemployment claims, on top of flat line or slightly negative GDP growth, tomorrows data should be a doooze. Our bias is for a number close to 700K in jobs lost and the unemployment number to be at least 8.5%. Many have called for numbers as high as 750K in job losses on top of a 8.7% unemployment rate. Keep in mind that employment, or the lack of it, is a lagging indicator. Chris has found a good chart that points those trends out quite nicely. Notice how the employment picture can look down right nasty and continue to do so, even though the economy and consumer may have bottomed and be on the rise. Reason for hope. As always, tomorrow’s data creates one, if not the most volatile trading days of the month. Given our call and that of others, it’s hard to see mortgage pricing or rates getting worse any time soon.


